An ECharts runtime executes ECharts machines (see Section 2.1). There are a number of configuration options and classes shared by ECharts runtimes to support runtime tasks such as monitoring and debugging. These are examined in the following sections.
All ECharts runtime options can be configured when the runtime is initialized. There are two techniques for configuring options when the runtime is initialized: (1) using a properties file and (2) using command-line options. Some of these options can also be configured programmatically after initialization by invoking methods defined by the ECharts runtime API.
If option configuration techniques are combined then the following precedence order is obeyed: method invocation overrides command-line options, and command-line options override properties file settings.
For the javamachine runtime, a properties file takes the usual Java properties file format where each line in the file is of the form:
Command-line options for the javamachine runtime take the usual format for defining Java virtual machine system properties with the java command, namely:
We discuss the various options in detail in the following sections.
If the ECharts runtime finds a file named echarts.properties in the runtime’s working directory then it will use the properties definitions found in that file. The runtime command line option org.echarts.properties.dir may also be used to specify a path to a directory other than the working directory in which to find the echarts.properties file.
When an ECharts runtime is initialized, the initialization options can be printed to standard output by setting the org.echarts.system.startupMessages option. This option is disabled (false) by default but can be enabled by setting the option to true. This option can only be configured from a properties file or from the command-line.
An ECharts runtime uses a default transition timer manager to support timed transitions. However, for some application domains it is appropriate to use a domain-specific transition timer manager. For example, the ECharts interface for SIP servlet containers defines its own transition timer manager. The org.echarts.system.transitionTimerManager.class property specifies a fully qualified class name for the ECharts runtime to use as its transition timer manager. The specified class must implement the org.echarts.TransitionTimerManager interface. The default value for this property is org.echarts.DefaultTransitionTimerManager. The runtime loads the specified class and creates an instance of it for use by the runtime. This option can only be configured from a properties file or from the command-line.
The default transition timer manager for the Javamachine runtime is not serializable because it was not designed for operation in a highly available environment. For this reason, delay transitions of a restored serialized machine (see Section 3.17) will never fire. However, since the ECharts runtime permits overriding the default transition timer manager, it is possible to avoid this constraint. For example, the transition timer manager implementation included with the ECharts for SIP Servlets Development Kit [7] uses the highly available timer facility provided by the underlying SIP servlet container.
An ECharts runtime includes a simple, configurable, extensible monitoring subsystem. This subsystem receives events generated by the runtime, optionally filters out particular events, and then formats and logs the events. The runtime uses this subsystem to support debugging, however, it can be used for many other purposes such as monitoring application-specific events. It can also easily be integrated with an application’s existing monitoring subsystem.
To log an event, an ECharts application must send it to a monitor (see Section 5.5.1). For example, the built-in ECharts trace debugger (see Section 5.6) sends a series of events to ECharts machine monitors during the course of a debugging session. Events are submitted to a monitor via the monitor’s putEvent() method (see Section 5.5.3). This method checks if the event passes through the monitor’s event filter (see Section 5.5.4) and, if it does, then it logs the event using the monitor’s formatter (see Section 5.5.5).
A runtime’s monitoring subsystem is disabled by default. When monitoring is disabled, no events are sent to the monitoring subsystem. To enable it, set the org.echarts.system.monitoring property to true, or invoke the setSystemMonitoring() method. In addition to enabling monitoring for the runtime, monitoring must be enabled for the individual machines from which you want to receive events. The simplest way to do this is to set the org.echarts.machine.monitoring property to true or invoke the setDefaultMachineMonitoring() method. This value is set to false by default. The value of this property is used as the default monitoring setting for newly created machines. This default value can be overridden for a particular machine by calling the setMachineMonitoring() method. The default behavior is that a child machine inherits the monitoring setting of its parent, so if you wish to use different monitoring settings in a parent and its child, you must use the setMachineMonitoring() method.
Each machine managed by an ECharts runtime has a monitor. Machines may share a monitor, or they may use different monitors. The org.echarts.machine.monitor.class property can be used to specify a fully qualified classname of a monitor. The specified class must implement the org.echarts.monitor.MachineMonitor interface. The runtime will load the class and create an instance of it to use as the default monitor for newly created machines. The default value for this property is org.echarts.monitor.PrintStreamMonitor (discussed in Sections 5.5.5 and 5.6). This default value can be overridden for a particular machine by calling the setMachineMonitor() method. The default behavior is that a child machine inherits the monitor of its parent, so if you wish to use different monitors between parent and child, you must use the setMachineMonitor() method.
For a discussion of monitor formatters and logging, see Section 5.5.5.
All monitor events are instances of the ECharts MachineMonitorEvent class. When an event instance is created it is automatically timestamped. An event also possesses a properties list of string key/value pairs. When an event is logged, as described in 5.5.5, then the event’s timestamp and properties list are printed.
Apart from the pre-defined trace debugger event classes, there is one additional pre-defined event class, the InfoEvent class. This event class can be used for a number of purposes by the programmer, for example, logging custom debug messages or exception stack traces. However, it is also possible to create custom event classes by simply subclassing the root MachineMonitorEvent class, or the InfoEvent class itself. Example0046 in Section 5.6.1 provides an example of using the InfoEvent class.
To submit an event to a monitor, the monitor’s putEvent() method must be invoked. A putEvent() method is also defined for each machine instance. The programmer may choose which of these putEvent() methods to invoke. Invoking a machine’s putEvent() method causes the input event to be augmented with four properties prior to calling the machine monitor’s putEvent() method. These additional properties are intended to associate the event with the machine producing the event. Example0046 in Section 5.6.1 provides an example of using a machine’s putEvent() method.
The MACHINE_ID and ROOT_MACHINE_ID properties specify the unique ID assigned to the machine instance producing the event and its root machine, respectively. The MACHINE_STATE_PATH property specifies the state path from the root machine to the machine producing the event. The SEQUENCE_ID property specifies the unique ID assigned to the transition sequence that the event is a member of (see Section 4.3 for a description of transition sequences). A sequence ID is actually the unique ID assigned to the port associated with the message transition that initiates the sequence.
If it is not desirable to augment events with these properties, then a machine monitor’s putEvent() method should be invoked directly rather than indirectly invoking it via the machine’s putEvent() method.
When a machine submits an event to its monitor via its putEvent() method, the monitor first passes the event through its event filter. If the event passes through the filter the event is logged, otherwise it is discarded. Defining an event filter for a monitor provides flexible, fine-grained control of a monitor’s logging levels.
An event filter is an instance of the MachineMonitorEventFilter class. A filter string is specified in the class constructor. A filter string specifies passing/discarding an event based on its (sub-)class or on its property values. A null or empty filter string passes all events. For example, here is an event string that passes InfoEvent instances whose MESSAGE property value is Hello, and discards InfoEvent instances whose MESSAGE property is World:
The filter string syntax supports more complex filters including the specification of regular expressions for property values and conjuncts of event classes. A complete description can be found in the MachineMonitorEventFilter class documentation.
The default event filter for the ECharts runtime’s default monitor (see Section 5.5.1) can be set during initialization with the org.echarts.machine.monitor.filterString property, or at runtime with the setDefaultMachineMonitorFilter() method. The default value for this property is the empty string, which passes all events.
Event logging refers to what a monitor does with an event once it passes through the monitor’s event filter. Typically, the event is logged to a file. Event formatting refers to how an event is portrayed in the event log. The logging task is performed by the monitor itself while the formatting task is performed by a monitor’s formatter. An ECharts runtime comes with four general purpose monitor classes: (1) a NullMonitor that effectively discards all events sent to it, (2) a PrintStreamMonitor that logs formatted events to a specified print stream, for example, a file or standard output, (3) a LoggerMonitor that logs formatted events to a specified java.util.logging.Logger instance (which supports log file rotation, among other things) and (4) a RawMonitor that logs unformatted events in their raw, binary format to a specified file. An ECharts runtime also comes with two formatter classes: (1) a PrettyPrintFormatter which formats events as easy-to-read strings, and (2) a TextFormatter which simply stringifies events in a machine-readable format. We will describe the output of the PrettyPrintFormatter in more detail in Section 5.6 devoted to the trace debugger.
A PrintStreamMonitor using a PrettyPrintMonitor is the default value for the ECharts runtime default monitor. Section 5.5.1 describes how the default monitor value can be set.
Programmers are free to extend any of the monitor or formatter classes for their own purposes in order to, for example, integrate ECharts runtime monitoring with an existing logging subsystem, or to customize runtime monitoring to suit their application needs.
An ECharts runtime supports trace debugging. When enabled, trace debugging generates a sequence of monitor events reflecting machine execution steps, namely, transition events and machine creation or destruction events.
The actual format of the events depends on the event formatter utilized by a machine’s monitor (see Section 5.5.5). In the examples shown in this section we will use the PrettyPrintFormatter. Here’s the complete trace debugger output produced when running the “Hello World” example from the beginning of this document (Section 2.1).
The time and event fields specify the time the event was created and the event’s class, respectively. Transition events are not created until immediately after the associated transition has fired. Since trace debug events are submitted to a machine’s putEvent() method, they include the four properties discussed in Section 5.5.3. The PrettyPrintFormatter formats these properties as the root, machine, state path, and sequence fields.
In this example, the root and machine fields specify the same machine since the root machine fired the transition. Since there are no submachines in this example, the state path simply specifies the root machine. Since the firing transition belongs to the initial sequence of messageless transitions that fire when a root machine is initialized by the runtime the ID is shown as initializing.
The next two fields are common to message transition and messageless transition events. The transition field specifies the source and target state references of the messageless transition that fired. Had the transition been a message transition, then the transition’s specified message class and a string representation of the message satisfying the transition are also displayed. In the case that a transition defines a compound target (see Section 3.4.3), then only the chosen target state reference is displayed. Finally, the local state field specifies the updated state of the machine in which the transition fired. Only states explicitly referenced by the transition’s target state are displayed. In the event that the affected states contain submachines, then the submachine states are also shown.
Now here’s a more complex example. First we show the machine and its environment. Then we show the trace debugger output resulting from running the machine’s environment.
The trace debugger output from this example shows two MachineLifecyleEvents. These events are associated with submachine creation and destruction. The created and destroyed fields indicate the parent state of the submachine being created or destroyed, respectively. It also shows the submachine’s class if the submachine is an external machine, otherwise it shows inner machine as illustrated above. The submachine field specifies the submachine instance’s unique ID. The trace also shows how an InfoEvent is displayed (see Section 5.5.2). Using InfoEvent’s is preferable to using a host language print statement because the event is logged and correlated in time with other trace debugger events. Furthermore, if the event was submitted to a machine’s putEvent() method as described in Section 5.5.3 then the event will be automatically augmented with a number of additional properties.
The examples above show the default output format produced by the PrettyPrintFormatter. The PrettyPrintFormatter also has methods to control the display of debugger events including how machine class names and machine states are portrayed. See the PrettyPrintFormatter class API for details.
A message transition event includes a string representation of the message that triggered the transition by default. For the javamachine runtime, the string is the result of calling the message object’s toString() method. However, it is possible to include more structured information about the message in the form of a properties list of string key/value pairs. Not only is the properties list maintained in a structured format in a monitor log, the individual keys and values can also be referenced in a event filter in a straightforward fashion (see Section 5.5.4). For the javamachine runtime, a message class should implement the org.echarts.monitor.Message interface to associate a properties list with a message. When a message transition event is created for a message implementing this interface, the message properties are added to the event’s properties. For an example, see the org.echarts.TransitionTimeoutMessage class. An instance of this class is sent by the ECharts runtime to a timer port when a timed transition expires. The message specifies three properties: DURATION, ACTIVATION_TIME, and EXPIRY_TIME.
The simplest way to enable trace debugging for a runtime consists of setting a single option: org.echarts.debugging. When this option is set to true then the appropriate debugging and monitoring options are set so that debugger events are sent to monitors for all machine instances.
If fine-grained control over debugging is desired then there are a number of other options available similar to those for monitors (see Section 5.5.1). First, monitoring must be enabled for a runtime and for the individual machines you wish to monitor in order for debug events to be received by the monitoring subsystem. Next, it is also necessary to enable debugging for the runtime and the individual machines you wish to monitor.
A runtime’s trace debugger is disabled by default. To enable it, set the org.echarts.system.debugging property to true, or invoke the setSystemDebugging() method. In addition to enabling debugging for the runtime, debugging must be enabled for the individual machines you want monitor. The simplest way to do this is to set the org.echarts.machine.debugging property to true or invoke the setDefaultMachineDebugging() method. This value is set to false by default. The value of this property is used as the default debugging setting for newly created machines. This default value can be overridden for a particular machine by calling the setMachineDebugging() method. The default behavior is that a child machine inherits the debugging setting of its parent, so if you wish to use different debugging settings in a parent and its child, you must use the setMachineDebugging() method.
If the system or machine debugging properties are disabled then debug events are not created and sent to monitors, regardless of a runtime’s monitor settings. Nonetheless, with monitoring enabled and debugging disabled it is possible to log non-debug events, such as InfoEvent instances (see Section 5.5.2).
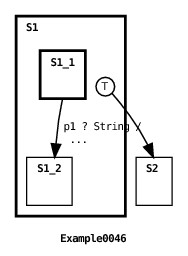
The local state field described in Section 5.6.1 provides a local view of machine state. Sometimes it is also desirable to obtain a global view, that is, a snapshot of a machine’s current or-states and and-states from the root machine downwards, recursively including the current states of all submachines. For even moderately complex machines, this snapshot can be hard to understand given the amount of information contained in it. Nevertheless it can sometimes be useful to periodically examine global machine state. For this reason, runtimes support printing global machine state immediately following the execution of a transition sequence (see Section 4.3). Here’s an example of the output produced by the PrettyPrintFormatter when this option is enabled.
This event corresponds to the global state of the Example0046 machine (discussed in Section 5.6.1) immediately after the initialization sequence that causes the creation of state S1’s submachine. In this example, the current machine or-state is state S1 and its submachine’s current or-state is S1_1.
Root machines and their monitors are responsible for producing global state events so be sure that you minimally enable debugging for the root machine of the machine you wish to collect global state events from. Furthermore, you must explicitly inform the runtime that you wish to collect global state events since this capability is disabled by default. To enable this capability for all newly created machine instances, set the org.echarts.machine.debugging.globalStateOutput to true, or invoke the setDefaultMachineDebuggingGlobalStateOutput() method. To enable or disable this capability for a particular (root) machine instance, use the setMachineDebuggingGlobalStateOutput() method.
| Property
| |
| Default Value | Section |
| org.echarts.properties.dir
| |
| . | 5.2 |
| org.echarts.system.startupMessages
| |
| false | 5.3 |
| org.echarts.system.transitionTimerManager.class
| |
| org.echarts.DefaultTransitionTimerManager | 5.4 |
| org.echarts.system.monitoring
| |
| false | 5.5.1 |
| org.echarts.machine.monitoring
| |
| false | 5.5.1 |
| org.echarts.machine.monitor.class
| |
| org.echarts.monitor.PrintStreamMonitor | 5.5.1 |
| org.echarts.machine.monitor.filterString
| |
| "" | 5.5.1 |
| org.echarts.debugging
| |
| false | 5.6.3 |
| org.echarts.system.debugging
| |
| false | 5.6.3 |
| org.echarts.machine.debugging
| |
| false | 5.6.3 |
| org.echarts.machine.debugging.globalStateOutput
| |
| false | 5.6.4 |